

A Step-by-Step Start Guide of Open Source Cloud Tools for SSL Decryption
Read Time: 20 Minutes .
During my tenure here at Nubeva, one of the things that has been a surprise to me is the lack of packet level security tools in the cloud. While there is a small selection to choose from, the cloud experience is often lacking when compared to on-premises versions. I wanted to find tools that were simple to install, added capability/efficiency/efficacy to the overall security architecture, and scaled with the cloud.
Almost everything I looked at failed the final test. Security tools that are designed to scale with the cloud and understand elasticity, ephemerality and encryption are simply MIA - missing in action. The solutions that seemed to be most applicable were the basic, open-source software tools that are prevalent in many security organizations today. At Nubeva, we took these tools and built a harness to make them simple and scalable in the cloud. We started with the five most useful, well understood and common tools.
- Wireshark for packet analysis and network troubleshooting
- Moloch for indexed packet capture
- Suricata for IDS
- Zeek for active security monitoring
- ntopng for network traffic flow monitoring
So dive in and I will show you how to build a complete set of cloud-scaling security tools for your AWS environment. This is currently only available for AWS. One of the next items on our roadmap is to convert these templates to Terraform which should support other clouds as well.
Getting ready..
First, let's review what we are going to build.
We are going to be deploying five open-source security & networking tools to your AWS Cloud environment. It deploys Moloch, ntopng, Suricata, Wireshark, and Zeek that provide advanced security visibility in your cloud. These tools are integrated with the Nubeva TLS Decryption solution with provides deeper visibility into all TLS traffic, including TLS 1.2 w/PFS and TLS 1.3. You can choose to create a new VPC environment for your open-source tools or deploy them into your existing VPC environment.
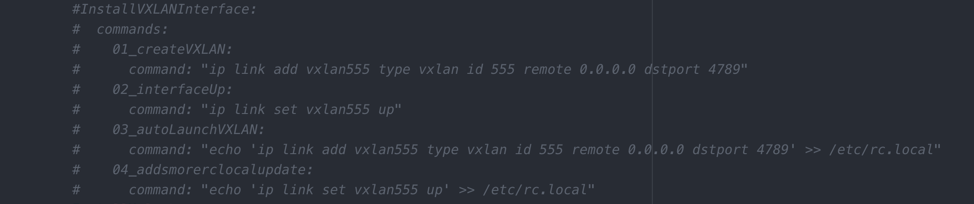
Side Note On Open Source: Here at Nubeva, we believe our software provides additional security and visibility to any organization. But if you are not ready for that yet, you can still use the templates and open source tools without any Nubeva integrations. If you look at the YAML files for each individual tool, you will see we have included a block of commented out code that will allow you to use the tools with a simple vxlan interface. It’s all there for you with, or without Nubeva Decryption.
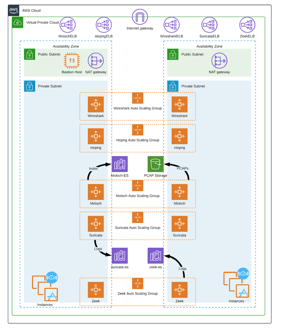
The Environment Overview
I want to highlight a few things about the deployment. We will be installing all of the tools into a brand new VPC. You can then peer this VPC with the rest of your cloud if you desire. You can also deploy the tools to an existing VPC if you prefer.
This is a highly available architecture that spans two Availability Zones. A VPC configured with public subnets according to AWS best practices, provides you with your own virtual network on AWS. All the gateways, subnets, & routes will be automatically created. You don’t have to worry about missing a step because they are all automated
Next, let's take a closer look at an individual tool and how it is built. Most of the tools follow a similar architecture, but some may use a few more resources and others. Here is a detailed diagram for Zeek. Zeek is a powerful network analysis framework that is much different from the typical signature-based IDS.
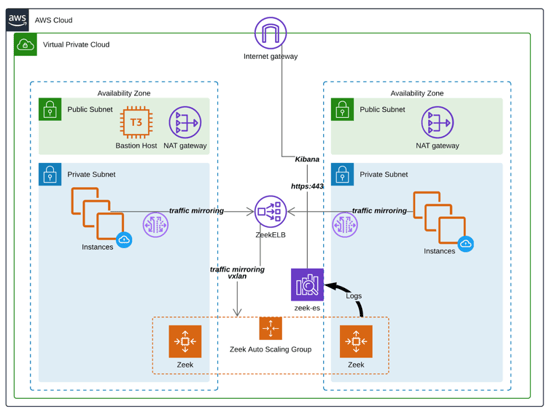
The most important thing to remember about every tool is that they are all configured to be accessible from the inside ONLY. There is no external connectivity configured, except SSH to the bastion. DNS resolution for the ELBs (elastic load balancers) results in only internal IP addresses.
The tools all deploy as Auto-Scaling Groups and use whatever you prefer as the instance type, though the default is m5.large. For Zeek, an AWS Elasticsearch Service domain is created called zeek-es. This service will hold all the logs and alerts created by ANY of the zeek instances in the ASG. The AWS Elasticsearch service also provides the kibana interface for visualizing the data. So even as Zeek instances are removed from service, the alerts will remain in the Elasticsearch database. Part of the ASG configuration also includes CloudWatch alarms that will increase and decrease the number of the Zeek worker nodes depending on individual instance network load. A Network Load Balancer is deployed to terminate Amazon VPC traffic mirrors from any instances. The associated TrafficMirrorTarget will also be created.
This scale-aware architecture ensures that the elastic nature of the cloud doesn't disrupt your security monitoring tools, unlike the single tool AMIs that are prevalent today. Each tool deploys similar services & resources as well. Let’s get started; in the next section, we will begin the installation after a few important notes and prerequisites.
Installing
Prerequisites
There are a few things that we need to do before launching the cloud formation template. For this installation, we will be creating a new VPC. But if you were deploying into an existing VPC, you will need to know the VPC CIDR Block as well as two public and two private subnets, located in two Availability Zones (AZs) for the installation.
One of the dependencies for many of the open source tools is the AWS Elasticsearch service. Using this service requires a service base IAM role. Simply look at your AWS Elasticsearch service ui @ https://console.aws.amazon.com/es/home. If you see this picture, then you probably need to run the following command.
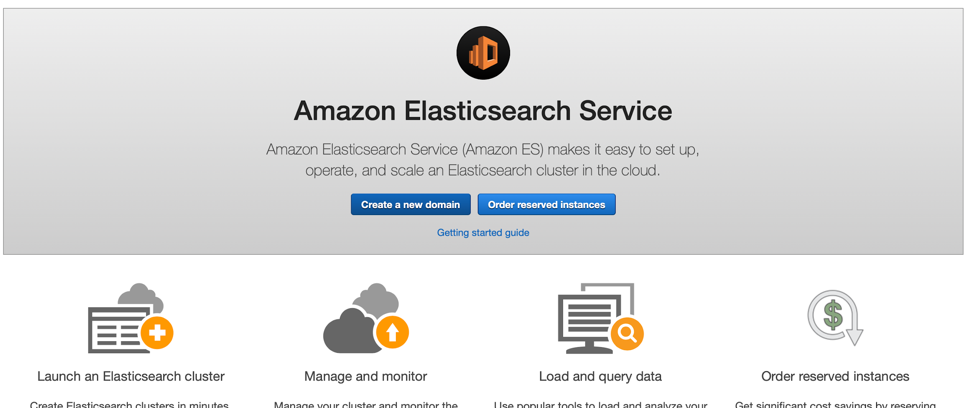
aws iam create-service-linked-role --aws-service-name es.amazonaws.com
If you see a list of domains, then you already have the appropriate IAM roles and can proceed to the installation.
Nubeva Account
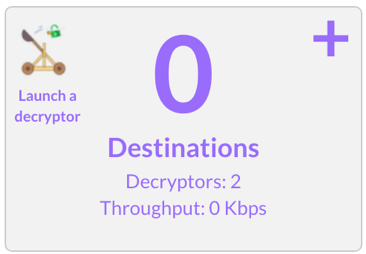
Next head over to the nubeva website, www.nubeva.com. You will need an account. If you need some more help there, check out this video. You want to click on the launch button on the Destinations box.
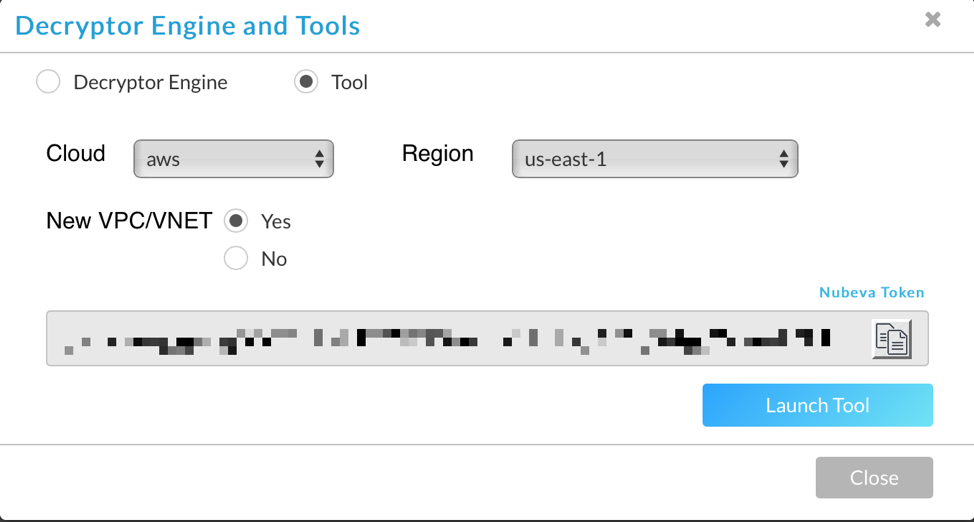
This will provide a few options to choose from. Currently only AWS is supported. Choose the region you want to deploy to. Here we are selecting a new VPC. Finally before you launch, copy in that Nubeva Token. You will need it in the next step. Click launch tool.
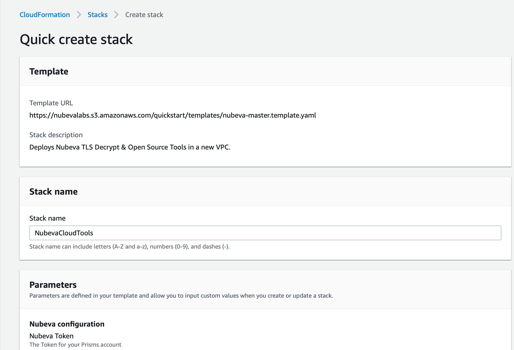
Cloud Formation Template
This takes us to the AWS UI where we can enter the parameters specific to our installation.
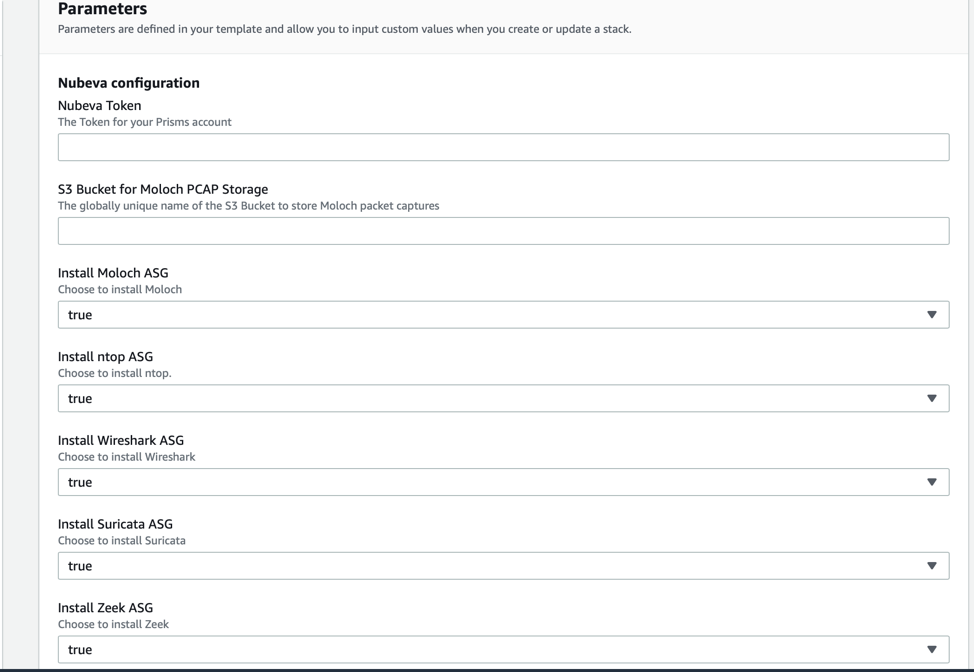
In the next section, configure the following parameters:
- Nubeva Token: Paste in the token from the prior screen
- For each of the 5 tools, change the parameter to “False” if you do not want it to install. By default, all 5 tools will be deployed.
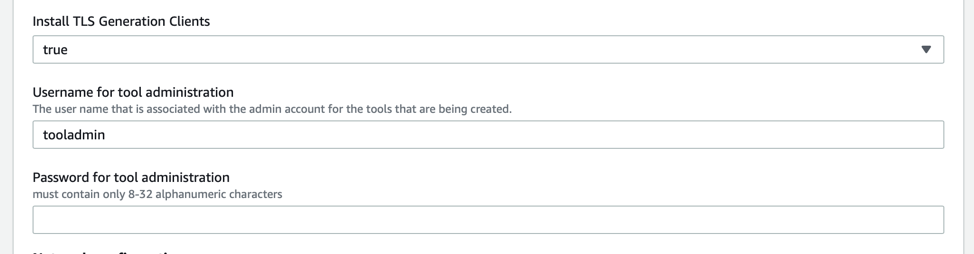
In the next section, configure the following parameters:
- TLS Generation Clients: by default, 2 clients will be deployed that are auto-generating some TLS connections including several items that will flag IDS alerts. This allows you to have a lab or proof-of-concept ready-to-go for testing TLS decrypted visibility in the cloud. If you want to configure your own workloads to generate traffic that can be mirrored, decrypted and inspected, just deploy a sensor on them after setting this value to false.
- Tool Username: This is the admin username for most of the tools. See the readme for the exact status as some of the tools still use the app defaults.
- Tool Password: Password to be used with the above username.
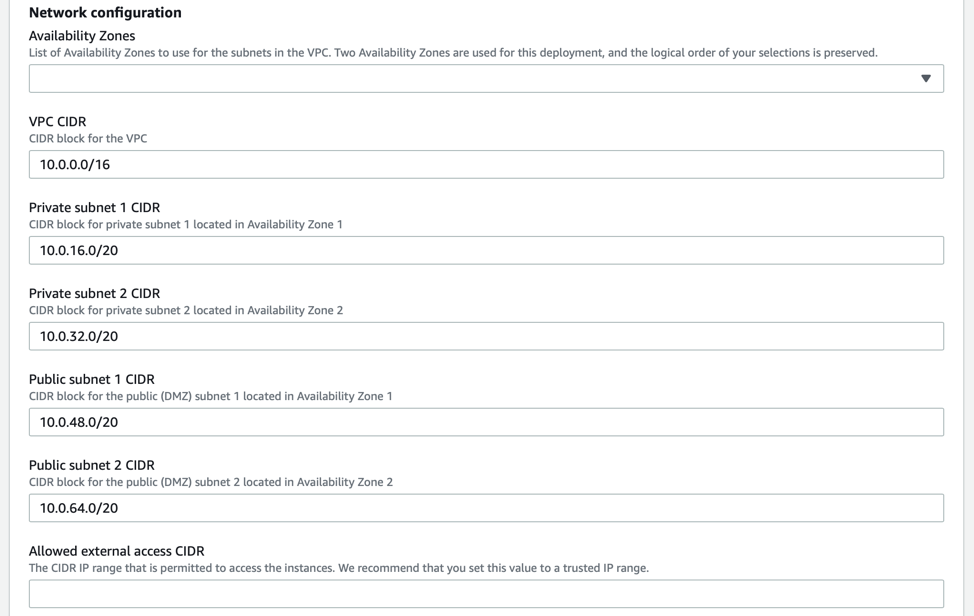
In the next section, configure the following networking parameters:
- Availability Zones: Choose 2 AZs to deploy the cloud tools into.
- VPC CIDR: The default CIDR is 10.0.0.0/16, but this can be changed to anything.
- 4 Subnet CIDRs: The defaults are from the default AWS quickstart. Or you can pick your own.
- Allowed External Access CIDR: This is what addresses are allowed to access any of the tools in the deployment. Please do NOT set this to 0.0.0.0/0. I will provide an additional way to connect to your tools in a later section.
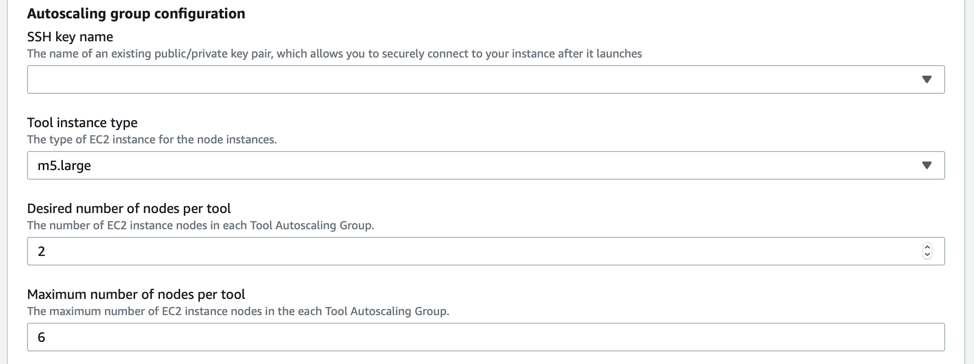
In the next section, configure the following ASG parameters:
- SSH Key Name: Choose your public key for the instances. You should already have one of these, but if you don’t, more information on keys & EC2 instances can be found here.
- Tool Instance Type: Select what size machine you want to install the solution onto. The default is an m5.large. This is the smallest recommended size for the tools.
- Desired Number of Nodes: Enter the minimum number of nodes to deploy. The default is 2.
- Maximum number of nodes: Enter the maximum number of nodes that can ever be deployed. You can never autoscale above this limit.
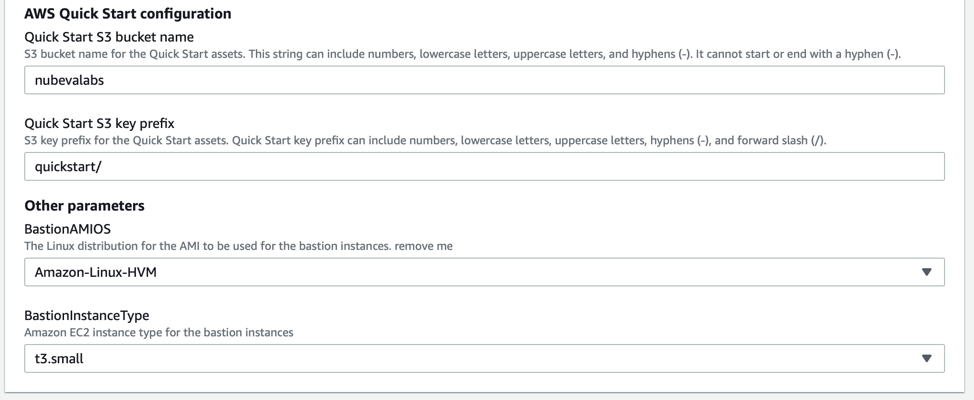
In the next section, configure the following parameters:
- Quick Start S3 Bucket Name: Leave this value alone.
- Quick Start S3 Key Prefix: No touchy because it will break things
- BastionAMIOS: Choose your preference
- Bastion Instance: Choose your preference.
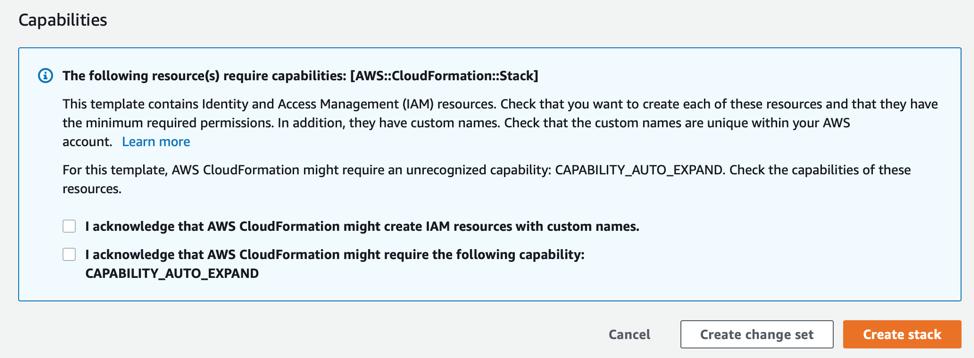
In the final section, click the 2 boxes allowing the creation of IAM resources as well as the auto-scaling for the tools. Then click “Create Stack”.
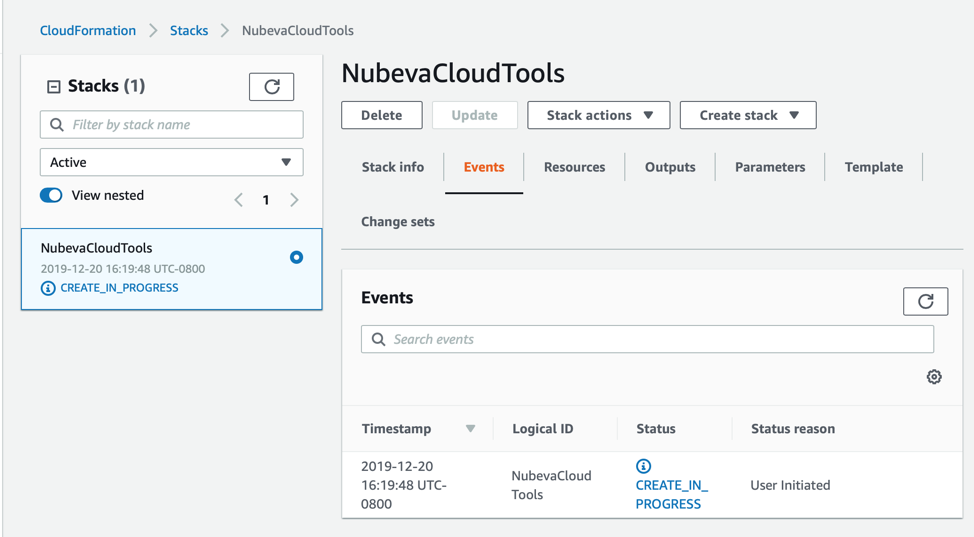
If everything is correct, then the stack should launch and the status screen should appear.
Waiting + What’s happening now
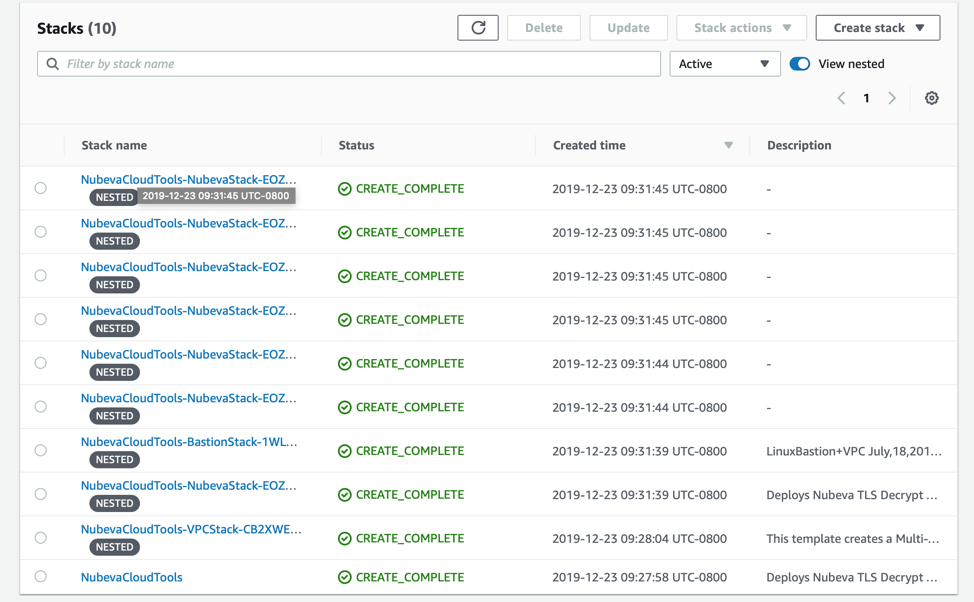
In a perfect world, everything will install correctly. Your cloud formation stack list should look similar to this.
But that may not happen every time. Sometimes things happen and resources don’t install correctly. If you need help, please keep reading about Troubleshooting and Nested Stacks. Otherwise, skip Connecting To The Tools below.
Let’s look at how the Cloudformation Stacks are put together.
Troubleshooting and Nested Stacks
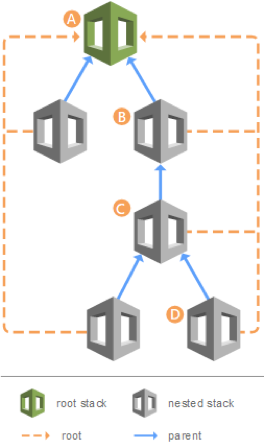
Nested stacks are stacks created as part of other stacks. For the Nubeva Cloud Tools deployment, there could be up to 11 discrete cloud formation templates that are used to build the complete environment. Nested stacks can themselves contain other nested stacks, resulting in a hierarchy of stacks, as in the diagram below. The root stack is the top-level stack to which all the nested stacks ultimately belong. In addition, each nested stack has an immediate parent stack. For the first level of nested stacks, the root stack is also the parent stack. in the diagram below, for example:
- Stack A is the root stack for all the other, nested, stacks in the hierarchy.
- For stack B, stack A is both the parent stack, as well as the root stack.
- For stack D, stack C is the parent stack; while for stack C, stack B is the parent stack.
Nested stacks, which are created as part of another stack, have an immediate parent stack, as well as the top-level root stack.
Nubeva Cloud Details Stack Layout
Nubeva Cloud Tools is made up of the following cloud formation templates, which are nested.
- nubeva-master.template.yaml: Root stack for New VPC Install
- aws-vpc.template: CFT to install new VPC
- linux-bastion-master.template: CFT to build bastion environment
- linux-bastion.template: CFT to build bastion itself
- nubeva-existing-vpc.template.yaml: Root stack for existing VPC Install & launch tools
- nubeva-moloch.template.yaml: CFT to build complete Moloch solution
- nubeva-suricata.template.yaml: CFT to build complete Suricata solution
- nubeva-wireshark.template.yaml: CFT to build complete Wireshark solution
- nubeva-ntop.template.yaml: CFT to build complete ntopng solution
- nubeva-zeek.template.yaml: CFT to build complete Zeek solution
- nubeva-tlsgen.template.yaml: CFT to build test clients
Troubleshooting Nested Stacks
As you can see Nested stacks make it easier to deploy resources in the cloud. But it can also make troubleshooting a little bit more difficult. By default, if the stack has any issues while loading, the entire stack will be rolled back. It is possible for every component to deploy correctly, except for the last step of one tool, which has a failure. This failure will cause every other cloudformation template to rollback and delete itself. When all of this is complete, the root stack will simply say “Rollback Complete”. You have to look deeper into the stacks for the root cause of the failure.
Before we look at how to troubleshoot the NubevaCloudTools stack, Now it is important to understand the “state” of a Cloudformation stack. There are only a few options:
Active: This is the default view on the CFT UI. It means a stack or nested stack is being deployed or updated.
Complete: A stack has successfully deployed
In Progress: A stack is being deployed
Failed: A stack failed to deploy and was not rolled-back or deleted.
Deleted: The stack launch failed and all components were deleted.
You can see older CFTs that meet these categories by clicking on this dropdown in the UI. This will help later when you are trying to diagnose why a stack failed.
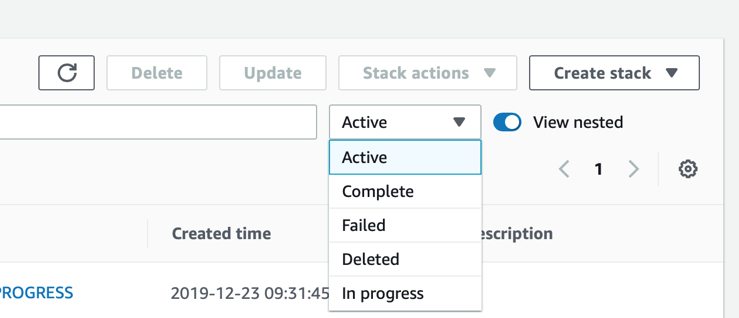
Here is a case where the stack failed.
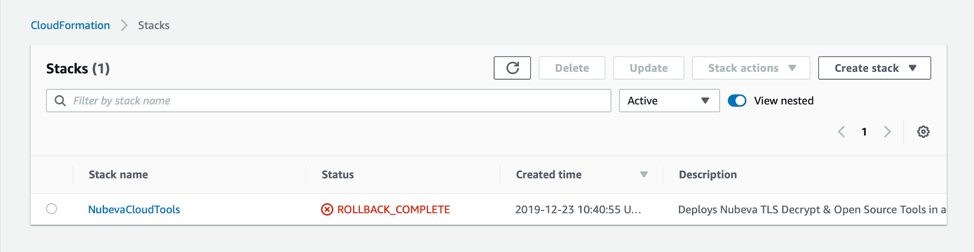
Let’s look closer at the Root Stack. It will provide either the exact error or a pointed to another stack.
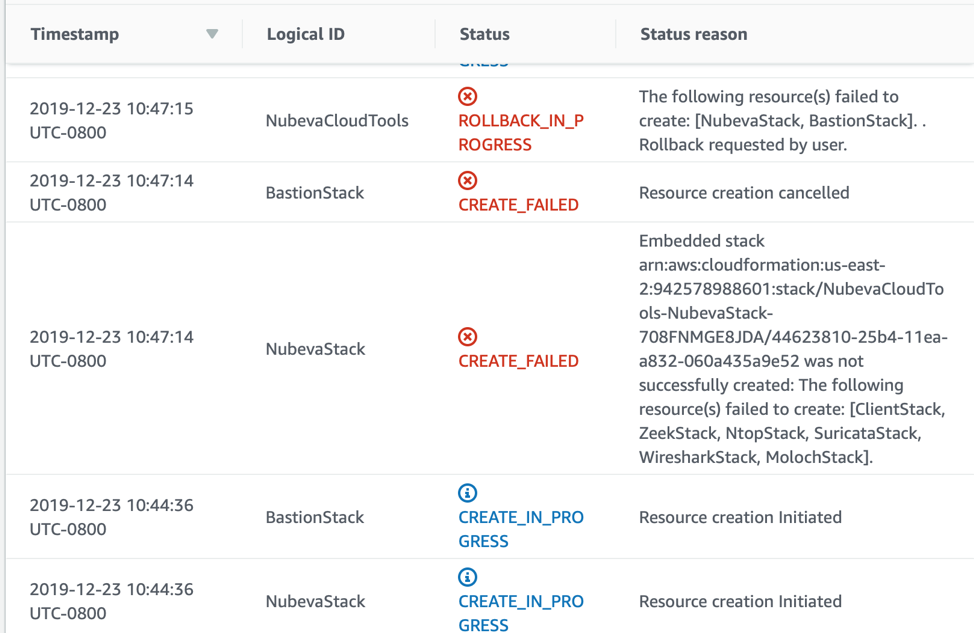
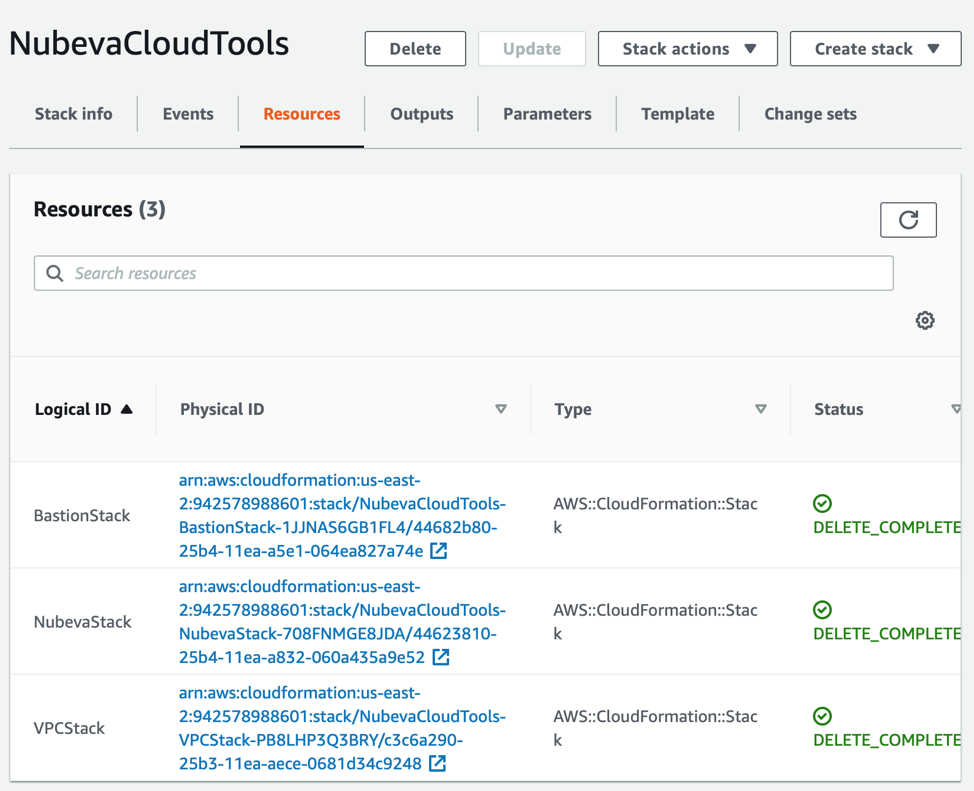
Here, the root stack is pointing us towards NubevaStack as the root cause. See that the BastionStack has a reason “Resource creation cancelled”. This means that these stacks were NOT part of the root cause. Let's look deeper at the NubevaStack. Remember this stack now has a “deleted” state. So that is why we didn’t see it on the main page. Now click on the “Resources” tab. This now provides an easy way to see the nested stacks. Go ahead and click on the NubevaStack.
Let's look at the events. We can see that we are getting closer to the root cause.
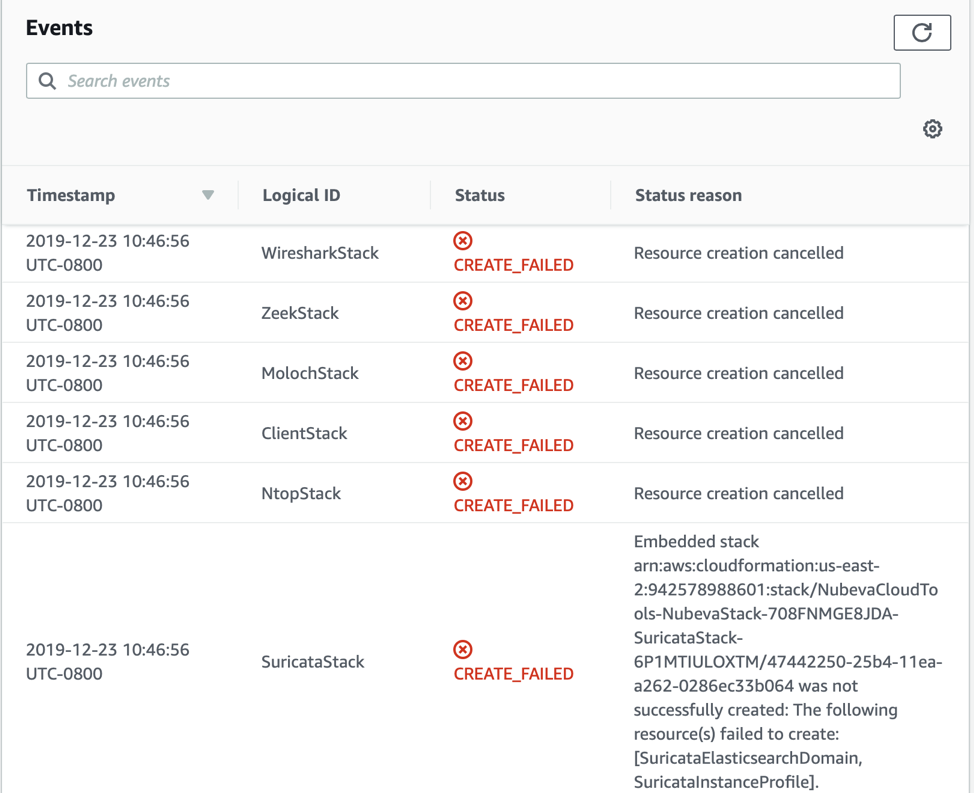
Similar to before, we can see that the root cause is the SuricataStack. The other stacks were simply a cascading rollback. We need to look deeper at the SuricataStack, specifically at the ElasticsearchDomain creation. So click on Resources and dive into the events for the SuricataStack.
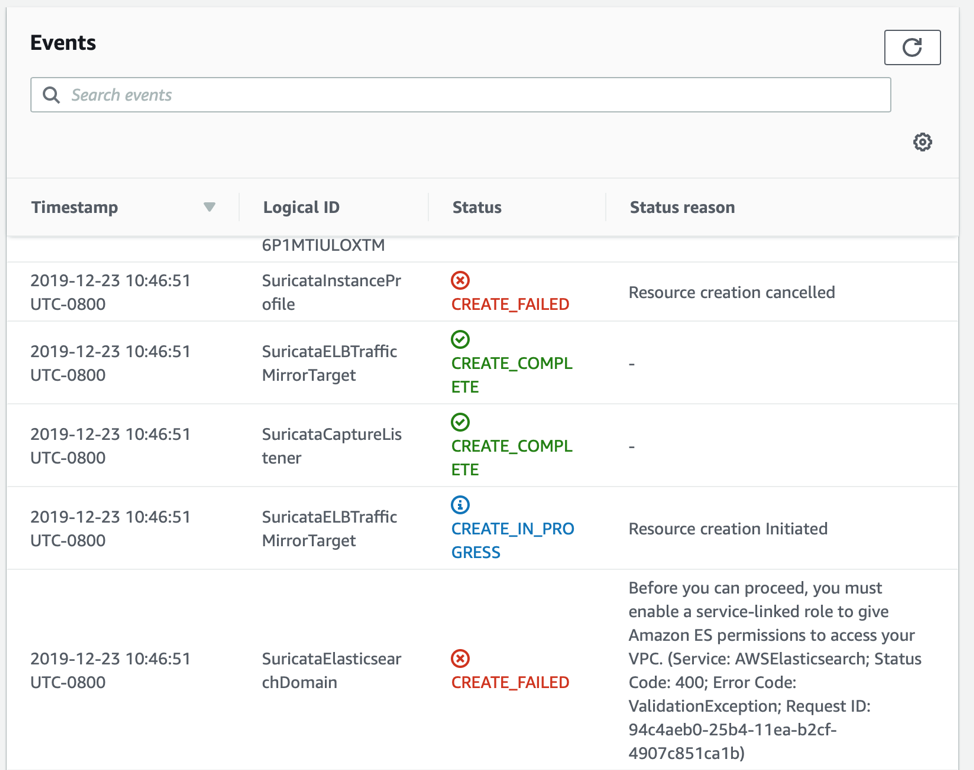
And finally we have the root cause. I picked this issue because it is likely that if you are reading this far into the troubleshooting section, you may be seeing a very similar error. This means that an earlier prerequisite was missed and there is no service-linked IAM role. Create that role with the following cli command.
aws iam create-service-linked-role --aws-service-name es.amazonaws.com
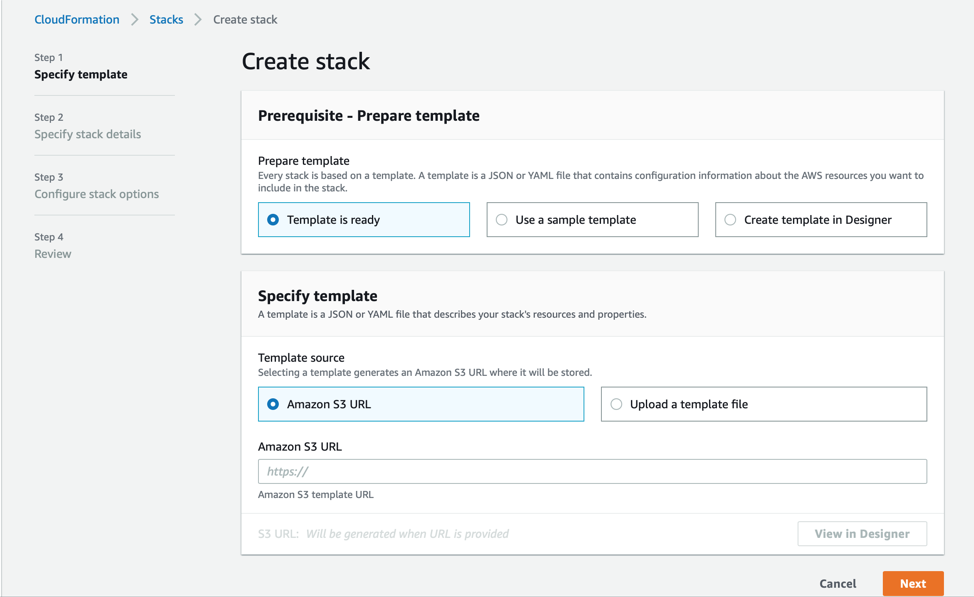
Use similar troubleshooting to review everything. If you are still seeing errors, you can always tell the stack to remain on failure. To do this, you will need to load the stack directly. From the AWS Cloudformation UI simply click on the create stack button.
On the next screen, paste in the correct Amazon S3 URL and hit next.:
New VPC: https://nubevalabs.s3.amazonaws.com/quickstart/templates/nubeva-master.template.yaml
Existing VPC: https://nubevalabs.s3.amazonaws.com/quickstart/templates/nubeva-existing-vpc.template.yaml
On the next screen you will configure the parameters the exact same way as you did in the Installing section above then click next.
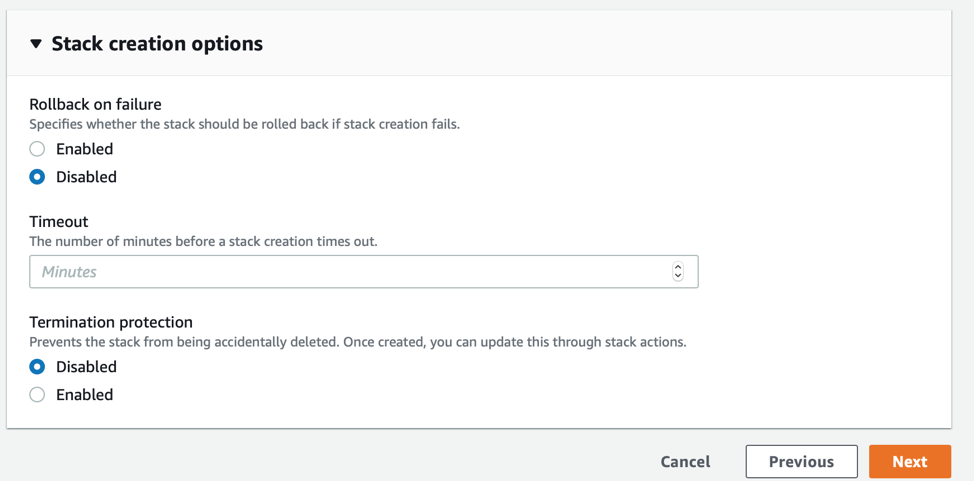
The next screen has a special configuration for rollback options. Here change the “rollback of failure” to disabled. This will ensure that the CFT will not be deleted and you can troubleshoot further. Then click next and install the template
Finally if none of that works, please open a ticket with us, support@nubeva.com, maybe we can help.
Connecting to the tools
Now if you are deploying Nubeva Cloud Tools into your cloud environment, you probably already have your connectivity sorted and you can attach a new VPC to a transit gateway or peered into another environment such as a Direct Connect. However, if none of those apply to you and you want a simple way to connect to the cloud environment, then let’s create a Client VPN to allow us to connect to this VPC.
Note: There are many ways to solve this problem in addition to my approach. Use whatever VPN solution you prefer.
To setup a complete Amazon Client VPN there are a few steps.
- I am not going to recreate the wheel, so here are the experts telling you how to do this. https://docs.aws.amazon.com/vpn/latest/clientvpn-admin/cvpn-getting-started.html https://aws.amazon.com/blogs/networking-and-content-delivery/introducing-aws-client-vpn-to-securely-access-aws-and-on-premises-resources/
- Just create a Client VPN Endpoint that uses MUTUAL authentication & transport TCP. Logging is optional for now. If you ever use this in production, log everything.
- You will also need to create the keys & certs for both the VPN endpoint and for your client. The 2nd key/cert will be used in later steps. https://docs.aws.amazon.com/vpn/latest/clientvpn-admin/authentication-authorization.html#mutual
- Associate Client VPN Endpoint to the VPC and assign the appropriate authorization rules.
- Download Tunnelblick. This is what you will use to connect to the client VPN Endpoint. Download the Client VPN endpoint configuration file from the AWS console. Add your key and cert from Step 3 to this config file using the following syntax.
<cert>
-----BEGIN CERTIFICATE-----
MIIDZjCCAk6gAwIBAgIQMLs4TNiF/wkPvd8O/Y0SVjANBgkqhkiG9w0BAQsFADAd
MRswGQYDVQQDDBJ2cGMubnViZXZhbGFicy5jb20wHhcNMTkxMTI1MjA1MDU5Whc
-----END CERTIFICATE-----
</cert>
<key>
-----BEGIN PRIVATE KEY-----
MIIEvAIBADANBgkqhkiG9w0BAQEFAASCBKYwggSiAgEAAoIBAQCl+Z6nSwk8Zz3K
sfd22qz9eSj/CbCewMW538O/fFhdNQEvV+PGUkzzhVoHbfsJbBZnNdxLQHhFPohy
-----END PRIVATE KEY-----
</key>
- Now, you should be able to make a mutual authentication VPN session to the newly created AWS VPC with your Nubeva Cloud Tools. Remember you are charged not only for active VPN connections, but also for every minute the Client VPN Endpoint is associated with the VPC. So if you are not actively using it, simply disassociate the VPC from the VPN endpoint. When you need to connect later, simple re-associate and everything reconnect.
Remember that you can also connect to the internal EC2 instances using the bastion host as a jump box.
ssh -i keyname.pem -J ec2-user@bastionip ec2-user@internalip
Finally, if you prefer a non-AWS VPN solution, you can easily stand up an OpenVPN server and use the exact same client setup including the mutual authentication. Start here. https://openvpn.net/community-resources/how-to/
Using the Tools
So now that everything is installed and you can connect to the Nubeva Cloud Tools, it is time to start working. Learning to properly use all the open source tools is beyond the scope of this technical blog. But let’s take a look at how to access everything and get started.
Create Amazon VPC Traffic Mirrors
You will need to go to your Amazon UI to create AWS mirrors to the security tools. The Amazon VPC traffic mirroring targets have already been created. Your targets UI should look similar to the screen below.
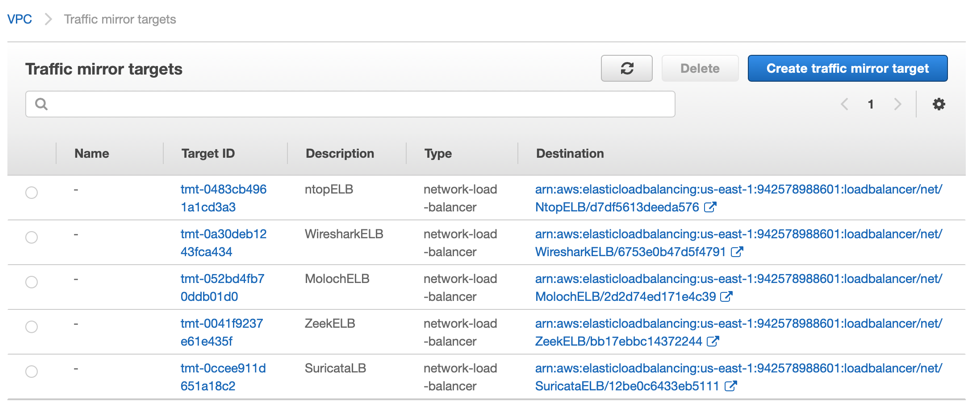
Next you will need to create a traffic mirror filter. Make sure to set it to send all traffic both inbound AND outbound. Finally, create a mirroring session from any source you choose, using the specified filter, and send to the traffic mirror targets that have been created. If you need more assistance, refer to the docs. https://docs.aws.amazon.com/vpc/latest/mirroring/traffic-mirroring-getting-started.html
Using Moloch
Moloch is accessible using the embedded HTTP viewer on port 8005 which is frontended by an Amazon Network Load Balancer. Lets look back at the CloudFormation Template for moloch. Lets focus on the Outputs.
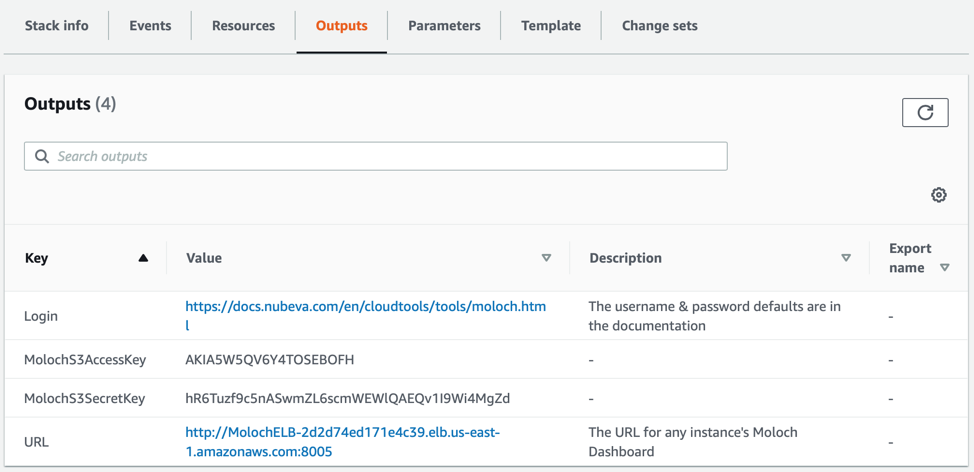
Here you can see several important bits of information. First you have a link back to some additional documentation including more details on connecting. Also, the credentials that are being used for S3 connectivity are displayed. The final line is actually the most critical. This URL will connect the user to any of the Moloch viewers that are available in the ELB server pool.
All you have to do is click on that link. You will be asked to put in the username & password that you configured as part of the CFT launch parameters back in “Installing”. If you need more, ssh into the EC2 instance directly or via the bastion jump box.
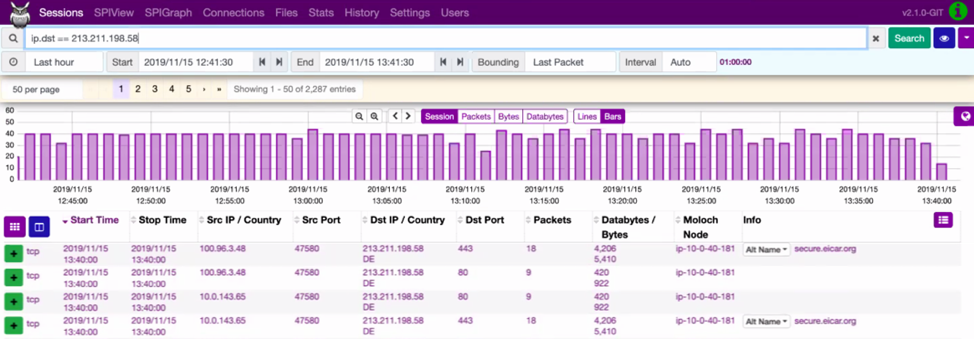
Once you’re connected, Moloch will let you search through and review both the encrypted and decrypted packets that you have sent its way via your mirror and the Nubeva decryptor.
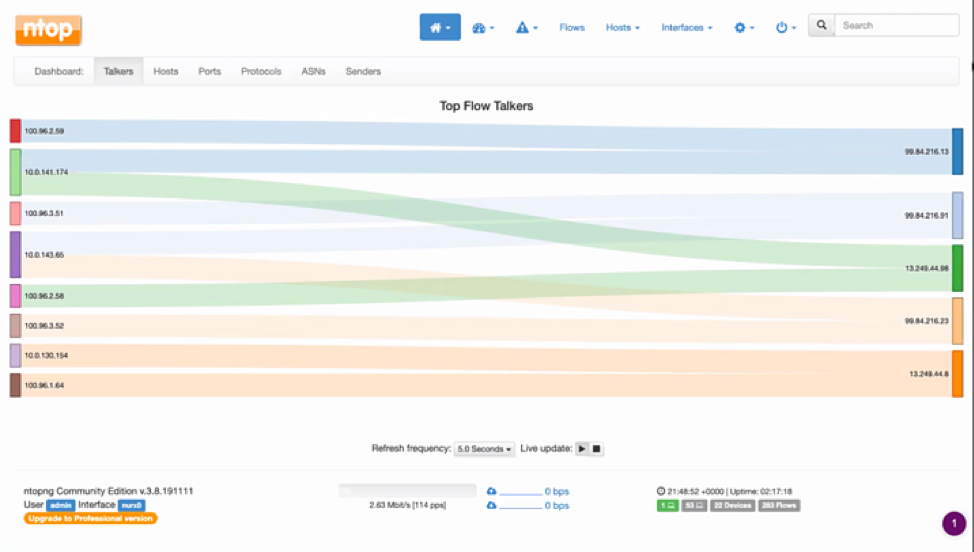
Using ntopng
ntopng is accessible using the embedded HTTP viewer on port 3000 which is frontended by an Amazon Network Load Balancer. Lets look back at the CloudFormation Template for ntopng. Lets focus on the Outputs.
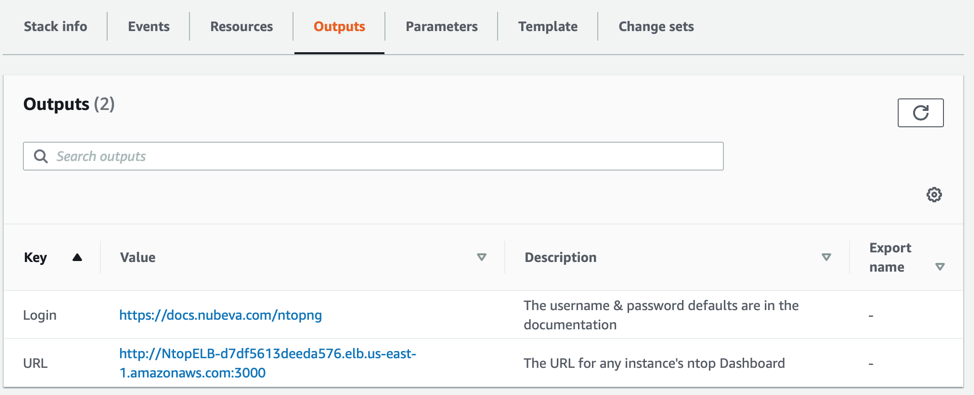
Here you can see two bits of information. First you have a link back to some additional documentation including more details on connecting. Again, the final line is actually the most critical. This URL will connect the user to any of the ntopng servers that are available in the ELB server pool.
All you have to do is click on that link. Currently the username & password are the DEFAULT for ntopng. Check the documentation for more. If you need more, ssh into the EC2 instance directly or via the bastion jump box.
Once you’re connected to ntopng you can get a nice visual representation of the traffic flow between the points you’ve connected with your Mirrors. The ntopng network traffic probe monitors network use and is based on libpcap and provides an intuitive, encrypted web-user interface for the exploration of real-time and historical traffic information.
Using Wireshark
Wireshark is accessible using RDP on port 3389 which is front ended by an Amazon Network Load Balancer. Lets look back at the CloudFormation Template for ntopng. Lets focus on the Outputs.
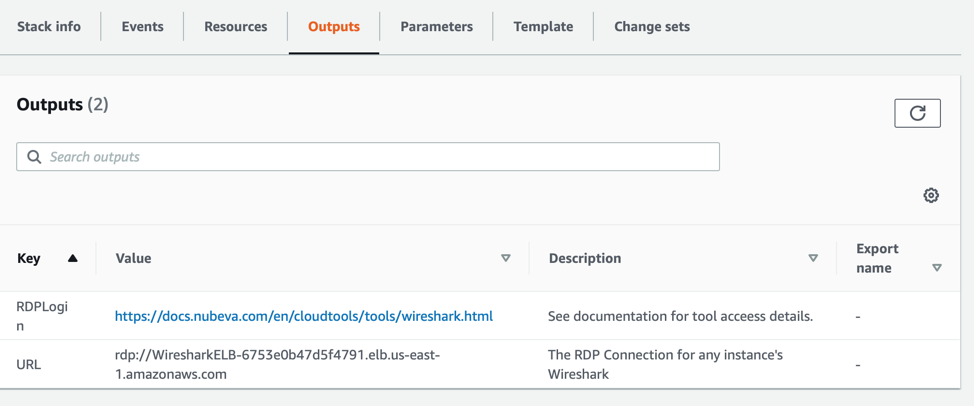
Here you can see two bits of information. First you have a link back to some additional documentation including more details on connecting. Again, the final line is actually the most critical. This is the hostname that you will RDP to using your favorite RDP Client.
Currently the username & password used as part of the RDP connection has to be manually configured. See the documentation for more details on how to configure this.
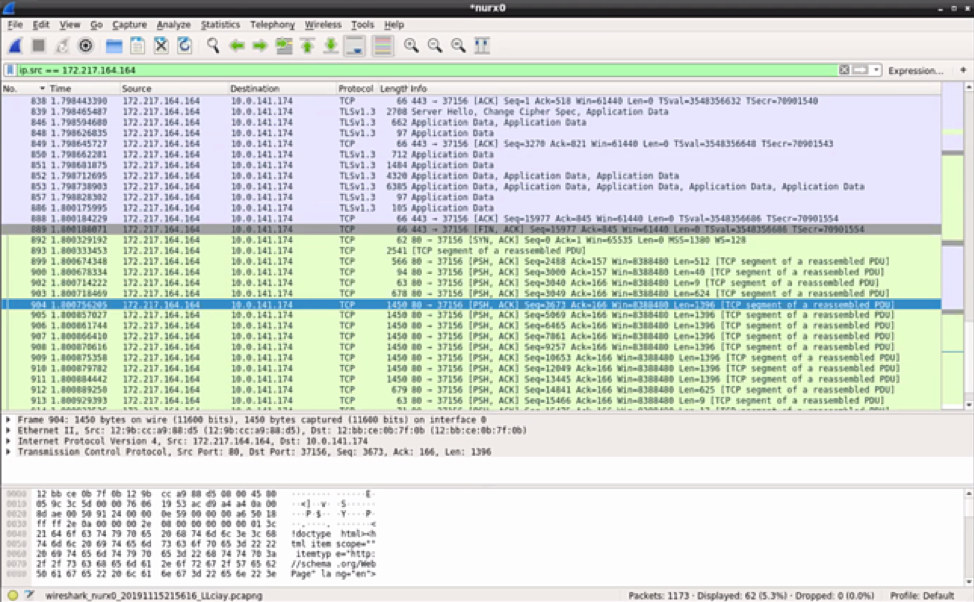
Once connected, you have access to one of the most common open-source packet analyzers for network troubleshooting, analysis, software and communications protocol development. The Cloud Tools you just set up enables you to stand up Wireshark to decrypt network traffic you send to it via the Mirrors. With Nubeva decryption enabled, Wireshark can improve not only your visibility but also the speed to resolution and complete full packet inspection of decrypted packets.
Using Suricata
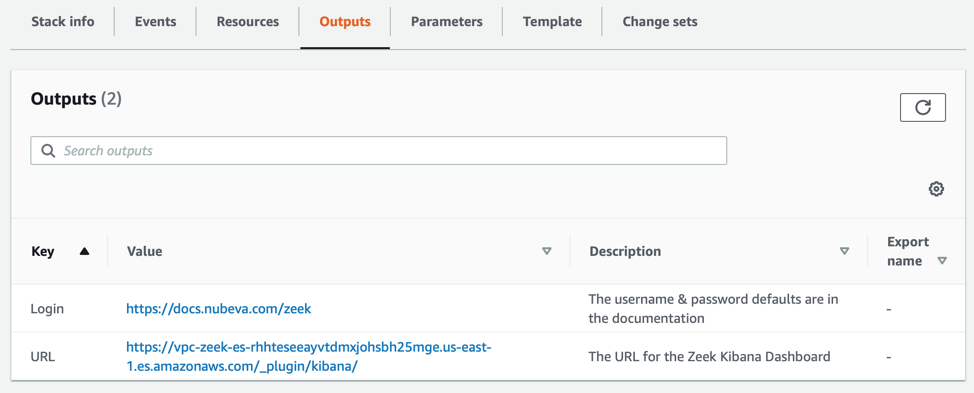
Suricata creates alerts in log files based on the traffic that it analyzes. These log files are shipped to an AWS Elasticsearch service using Logstash. The data in the AWS Elasticsearch service is visualized using the built-in Kibana software. There is also a Network Load Balancer to ensure that mirrored traffic always lands on the correct backend suricata instance. Lets look back at the CloudFormation Template for ntopng. Lets focus on the Outputs.
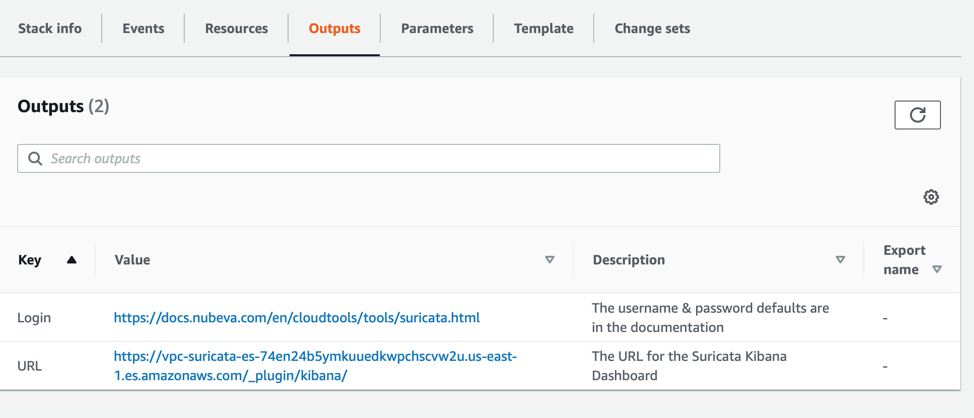
Here you can see two bits of information. First you have a link back to some additional documentation including more details on connecting. Again, the final line is actually the most critical. This URL will connect the user to the kibana UI for AWS Elasticsearch.
All you have to do is click on that link. Currently there are no credentials required, but the first time you connect you will have to create an index. The index will ALWAYS be “logstash-*”. Once that is set, you will be able to see all your alerts. If you need more, ssh into the EC2 instance directly or via the bastion jump box.
Once connected, you can utilize Suricata to match on known threats, identify policy violations, flag malicious behavior and alert and event filtering. These Nubeva Cloud Tools with Nubeva decrypt solves for modern decryption to enhance Suricata for end users.
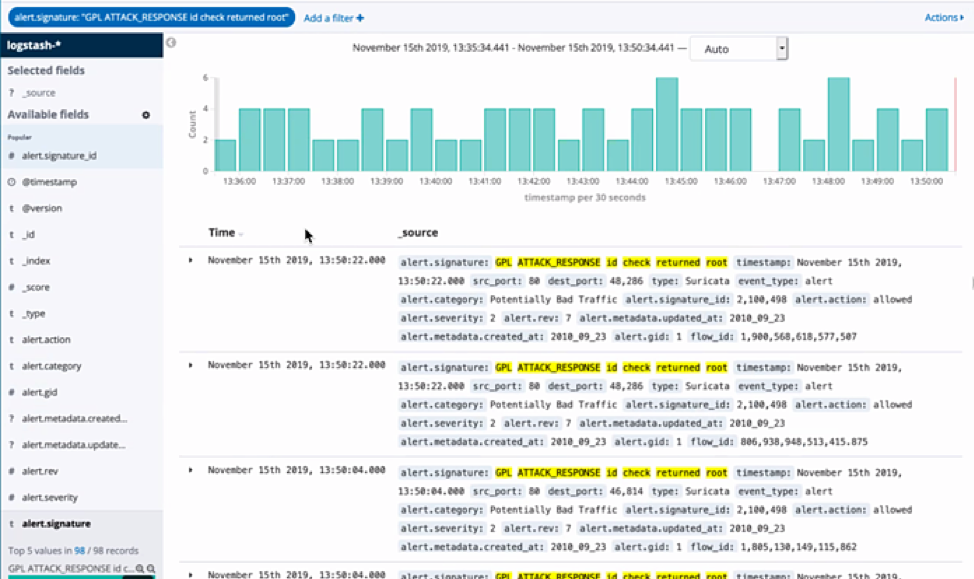
Using Zeek
Zeek is a powerful network analysis framework used for Intrusion Detection Systems. Zeek helps to perform security monitoring by looking at network activity to find suspicious data flows. Based on the findings, it alerts, reacts and integrates with other tools including traffic inspection, attack detection, log recordings and analysis. With more than 70% of traffic now encrypted with TLS 1.3 and perfect forward secrecy, Zeek loses some of its power as packets are encrypted. Nubeva Cloud Tools allows Zeek users to reintroduce decrypted visibility within just a few minutes.
Just like with Suricata, connect to the Kibana link in the Zeek CTF Output section for access. Be sure to point all VPC traffic mirroring sessions at the Traffic Mirror Target (TMT) for the ZeekELB. This will ensure that the mirrors are sent to any active Zeek worker. This leverages UDP load balancing, so flows will stick on the Zeek workers.
All Zeek logs are sent to the AWS ElasticSearch Service that is created during the CFT process.
All that is left to integrate Zeek data into your security and monitoring processes is to view the zeek data. To do this, simply use a web browser to connect to the Kibana URL specified in the output of the Zeek CFT.
Conclusion
With your Nubeva Cloud Tools installation complete, you can quickly dive into using open source security tools in the cloud. From here you can explore into many different areas such as packet level troubleshooting of a server. Or sampling network traffic into Zeek & Suricata to see if any alerts are present. This will provide a solid foundation to explore cloud security.
